An agentic OS dashboard is the single screen where all your AI agents and custom workflows live together — mission control for your automation. Instead of scattered apps and terminals, everything is one click away and shares one memory. Here's what an agentic OS dashboard is, what's on it, and how to get one.
📺 Watch: LIVE: Building Agentic Operating Systems with Claude
Want a ready-made agentic OS dashboard? Get it inside the AI Profit Boardroom. → Join AIPB
What Is An Agentic OS Dashboard?
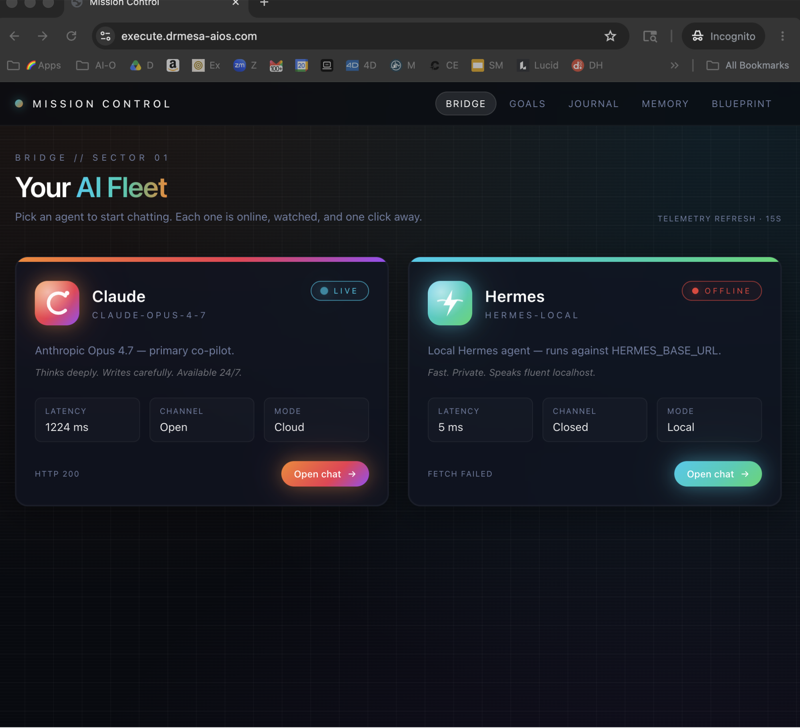
It's the front end of an agent operating system: a clean dashboard where you run every agent (Claude, Hermes, Codex), trigger custom workflows, see live activity, and browse everything you've built. Think of it as the cockpit for all your AI automation.
Why A Dashboard Beats Scattered Apps
Without a dashboard, your agents live in separate apps that don't talk to each other — you lose context, repeat yourself, and can't find what you built. A dashboard fixes that: one place, shared memory, everything organised and reusable.
What's On An Agentic OS Dashboard
- Mission control — every agent and CLI in one view, with live activity.
- Custom workflows — video agent, SEO pipeline, lead gen, trending news, image and music studios.
- Memory — a shared Obsidian vault every agent reads from.
- Orchestration — a group chat and Kanban board where agents work as a team.
- Gallery and history — everything you've built, saved and searchable.
📺 Watch: How I Run My Entire SEO From One Dashboard
How To Build An Agentic OS Dashboard
Prompt an agent (GPT-5.6 Codex or Claude) to "create a mission control dashboard for my agents, clean and working," then add features one by one and wire in memory. For the full walkthrough, see how to build an agentic OS.
📺 Watch: NEW Claude 5 + Agentic Operating System!
Get A Ready-Made Dashboard
The fastest route is a ready-made dashboard you install and customise. Our Agent OS dashboard — mission control, workflows, memory and orchestration — is inside the AI Profit Boardroom with a video tutorial and install zip. → Join AIPB.
Frequently Asked Questions
What is an agentic OS dashboard?
A single dashboard that runs all your AI agents and custom workflows with shared memory — the control centre for your AI automation, instead of scattered apps.
How do I get an agentic OS dashboard?
Build one by prompting an agent to code a mission-control dashboard, or install a ready-made template like the Agent OS in the AI Profit Boardroom and customise it.
What should be on the dashboard?
Mission control, custom workflows (content, video, leads), a shared memory system, agent orchestration, and a gallery and history so nothing gets lost.
The Bottom Line
An agentic OS dashboard turns scattered AI tools into one organised command centre — agents, workflows, memory and orchestration on a single screen. Build your own, or get a ready-made one inside the AI Profit Boardroom.
Going Deeper: What a Great Agentic OS Dashboard Actually Shows On Screen
The building blocks above tell you what belongs in an agentic OS dashboard. This section gets specific about what they look like on screen — the panels, numbers and signals that separate one you glance at once from one you keep open all day. If you are building or buying one, this detail decides whether it earns its place.
Agent status at a glance
The first thing a good dashboard answers is simple: which agents are awake, and what are they doing? Every agent gets a status chip with a clear state — idle, running, waiting on input, blocked, or errored. Colour carries meaning: green for healthy, amber for waiting, red for failed. A running agent shows the current step and how long it has been on it, so a job that has quietly hung for twenty minutes stands out instead of hiding.
Add a last-seen timestamp and a heartbeat. If an agent stops reporting, the chip should go stale on its own rather than showing a comforting green that is actually frozen. Trust collapses the first time a dashboard says everything is fine while something is broken.
Task queues: the work in flight
Underneath the agents sits the work. A task queue shows every job as a row that moves through columns — queued, in progress, done, failed — much like a Kanban board built for machines. Each row carries who owns it, when it started, and a retry count. When something fails, you want it visible and re-runnable in one click, not buried in a terminal you closed hours ago. Queues also expose bottlenecks: if jobs stack up behind one slow agent, the pile-up is obvious and you can rebalance before the backlog becomes missed work.
Live logs: what the agent is doing right now
Status tells you the state; logs tell you the story. A live log panel streams each agent's output as it happens — the tool it called, the file it touched, the decision it made. Good panels let you filter by agent, pin one stream, and search back through history. When an agent goes off the rails, the log is where you catch it, and streaming logs in real time turns debugging from guesswork into reading.
KPIs that actually matter
Vanity numbers make a dashboard look busy; useful numbers change what you do next. The metrics worth a permanent tile are tied to outcomes: tasks completed today, success rate, average time per task, and rough token or compute cost so spending never surprises you. Above all, track time saved — the hours of manual work your agents removed this week. That single figure justifies the whole system to anyone who asks.
An example layout walkthrough
Picture the screen as four regions. A slim top bar carries global KPIs — jobs done today, success rate, cost — so headline health is always in view. A left rail lists your agents as clickable status chips. The wide centre is the task queue, the busiest and most-watched area. A right rail streams live logs for the agent or job you have selected. Below the fold sit your workflows and a searchable gallery of everything built.
The logic is priority by position: what you check most sits highest and widest, and detail is one click away rather than crammed in. You should read the top bar in two seconds and know whether today is going well.
How to wire the dashboard to real agents
A dashboard is only as good as the data behind it, so the wiring matters as much as the layout. Give each agent a small, shared place to report — a status file, a database table, or a simple endpoint it writes to as it works. The dashboard reads that source and reflects it.
Three signals do most of the job. First, status updates: the agent writes its state and current step each time it changes. Second, a log stream the panel can tail. Third, task events — created, started, finished, failed — that feed the queue. Keep the refresh sensible: a few seconds is plenty. Point every agent at the same shared memory, and the dashboard stops being a mock-up and starts reflecting reality.
Monitoring pitfalls to avoid
- Alert fatigue. If everything pings, you soon ignore all of it. Alert only on failures and genuine stalls, not routine progress.
- Vanity metrics. A wall of numbers nobody acts on is decoration. Keep the tiles that change decisions and cut the rest.
- Stale data shown as fresh. Always display last-updated times and let panels go grey when a feed dies.
- Silent failures. A failed job that shows no red is worse than no dashboard at all — surface every error loudly.
- Too much at once. A cluttered screen hides problems. Show the essentials and keep depth one click away.
If you want a mission-control dashboard that saves you hours every week, check out the AI Profit Boardroom — a ready-made Agent OS dashboard with live agent status, task queues and logs, plus a video tutorial and install files. → Get the ready-made Agent OS dashboard
More questions, answered
How often should the dashboard refresh? For most set-ups, every few seconds is ample — fast enough to feel live, slow enough that polling is not its own load.
Can I monitor several agents at once? Yes, that is the point. Status chips give you the whole fleet at a glance, and you drill into any agent's logs when needed.
Which KPI matters most? Time saved. Tasks and success rates are useful, but hours of manual work removed is the number that proves the system is worth running.
Do I need to code it myself? Not necessarily. You can prompt an agent to build one, or start from a ready-made template and customise — far quicker than a blank screen.
Get the visible layer right, and an agentic OS dashboard stops being a status page and becomes the place you run your business from.